I keep reading news about the San Antonio real estate market being
really strong, and as a real estate broker that is good news. However, in a city with over 1.2 million
residents, I wanted to know where the market is truly improving. In considering where to research first, I
thought where better than in my neck of the woods. So, I went to work
researching the 78258 zip code which incorporated the areas commonly known as
Stone Oak.
Before I give out all of the exciting details, I first want to lay out
the parameters of my research. All data
utilized came from the SABOR MLS system. This is an important factor because
the research will exclude for sale by owner properties and new builder homes not
listed in the MLS. Second, I only researched
single family detached residences. Next, I considered all closed transactions
from January 2010 through October 28, 2013. I also included the pending contracts and active option contracts as of
October 28, 2013. In addition, I wanted
to know the amount of current inventory available, so I ran the active single
family residences in 78258 on October 29, 2013. All sales were considered on a price per square foot basis as this is
the best unit of measurement when comparing single family residences. I placed emphasis on the mean or average sales
price per square foot and cumulative days on the market as I consider the
average a more honest representation of actual market trends.
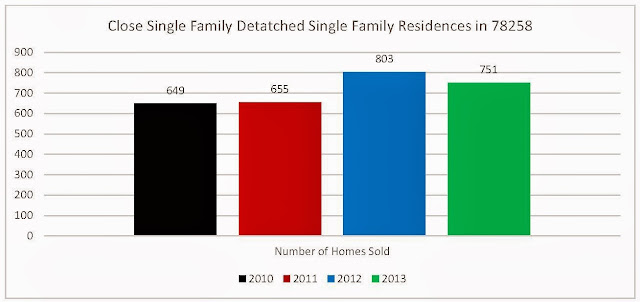
The first comparison covers the total number of home sales per year, and
chart is provided below to illustrate the findings.
As evidenced from the chart above, the number of homes sold per year was relatively the same from 2010 to 2011. However, a dramatic increase of over 22% is noted from year 2011 to
2012. I realize 2013 has not eclipsed
2012 yet, but we are only through October. I did not chart pending contracts and active option contracts as some
may very well not close and fund. Currently, there are 56 pending contracts in escrow, and another 25
active option contracts in escrow.
Theses pending sales total 81 additional transactions which if close and
fund will bring the 2013 total number of sales to 832 units, which surpasses
2012 by 3.6%. This is a modest increase,
but there are two months remaining in the year for the total to continue to
increase.
My next case study observes the sales price per square foot per unit
within the 78258 zip code. Again, I look
at sales price per square foot rather than total sales price to account for the
variable of size per home.
This chart really needs no clever explanation. We are experiencing the highest average sale
prices per square foot per home during the past four years, and I see no reason
for this trend not to continue into 2014. I will explore that reasoning later in this blog.
Next, let’s look at marketing times. Everyone trying to sell the home would like to have an indication of how
long it will take, so they can be prepared. We have to find a new home, meet with our lender, pack our house, set up
and disconnect utilities. These things
take time and planning, so it’s always comforting to be able to construct a
time line. When considering marketing
times, I always consider the cumulative days on the market. Cumulative days on the market take into
account all days listed on the market regardless of the Real Estate Company,
agent or number of times listed.

Again, there is no need for lengthy explanation here. In 2013, the total marketing times for homes
within the 78258 zip code have reduced on average by over a full month.
So what conclusions did I draw from my research project? First, the total number of homes within the
area studied are on the rise. Second,
the sales price per square foot per home is increasing. Third, homes are selling faster than ever
during the past four years. Independently, each of these three factors suggest the market is
improving. However, when combined, all
three factors together illustrate the market is improving at a torrid
pace. With that being said, I would like
to add one more aspect to consider. Currently, there are only 204 single family detached residences actively
listed on the market within the 78258 zip code, and that equates to barely 25%
of the closed and pending homes sales during 2013. Additionally, the average
asking price per square foot of these current listings is $137.00. Now that is HOT!
For our expert opinion on your home call River Valley Real Estate
Company at (210)853-5327 or e-mail Bill Barkley at bill@rvreco.com. We
would love the opportunity to present our marketing platform, and discuss your
real estate needs.


No comments:
Post a Comment